Musical Score#
The internal representation of a CompositeBloq is a directed acyclic graph. Here, we lay out that graph on a “musical score”, which avoids the problems of edges crossing over each other and is more familiar to quantum computing practitioners.
A musical score is one where time proceeds from left to right and each horizontal line represents a qubit or register of qubits.
Graph#
Below is a graphviz-rendered view of a 4-bit and’s decomposition.
from qualtran.bloqs.mcmt import MultiAnd
from qualtran.drawing import show_bloq

cbloq = MultiAnd((1,1,0,1)).decompose_bloq()
show_bloq(cbloq)

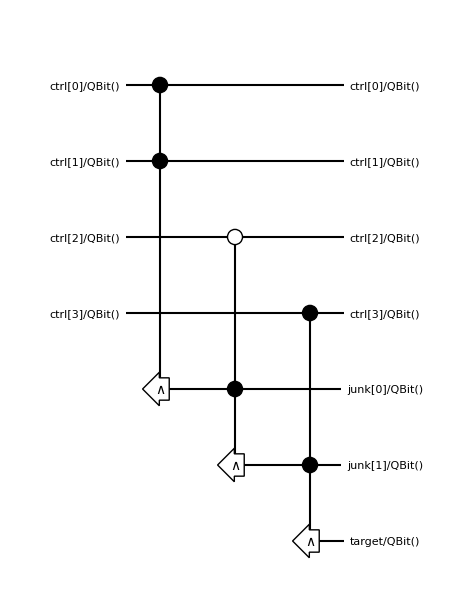
Matplotlib musical score#
The first step to drawing a musical score diagram is to call get_musical_score_data on the composite bloq, which will lay out the various symbols on the score and return a data structure containing position and other information. We provide two backends for actually drawing the score as laid out in msd. draw_musical_score will use matplotlib to draw a diagram.
from qualtran.drawing import get_musical_score_data, draw_musical_score
msd = get_musical_score_data(cbloq)
fig, ax = draw_musical_score(msd)
fig.tight_layout()
Javascript musical score#
We can dump the salient visualization information to JSON so it can be loaded from javascript and displayed using the d3-based drawing utilities in musical_score.js. See musical_score.html where we load in this information.
from qualtran.drawing import dump_musical_score

dump_musical_score(msd, name='musical_score_example')